
Global buyers are asking a sharper question: how much can an LED display save after installation, not only during a showroom demonstration? The U.S. Department of Energy reports that LED lighting can use at least 75% less energy than incandescent lighting and last up to 25 times longer. However, that benchmark does not directly describe commercial LED screens. Display power depends on pixel pitch, cabinet size, brightness, refresh rate, image content, and operating hours.
This guide, “10 Energy Saving LED Display Tips for Global Buyers,” turns those variables into practical purchasing checks. The International Energy Agency’s Energy Efficiency 2023 report identifies efficient lighting and better controls as important tools for reducing electricity demand. That principle also applies to digital signage. A screen running at maximum brightness in a covered shopping mall may waste energy. A brightness sensor, scheduled dimming, and efficient power supplies can produce more meaningful savings.
Small details matter.
Ask suppliers for measured power consumption, not only peak wattage. Request test conditions, cabinet specifications, and energy data from recognized laboratories. Compare watts per square meter, warranty terms, thermal design, and control-system compatibility. These details reveal whether an energy saving LED display will perform efficiently in a real installation.
The process is not perfectly simple. A lower wattage label may hide weaker brightness or shorter component life. Outdoor displays also face heat, rain, and dust. Therefore, buyers should evaluate total cost, service access, and expected lifetime together. This approach reflects guidance from the U.S. DOE solid-state lighting research community and practical experience from international signage projects. Efficient purchasing begins with evidence, not impressive claims.
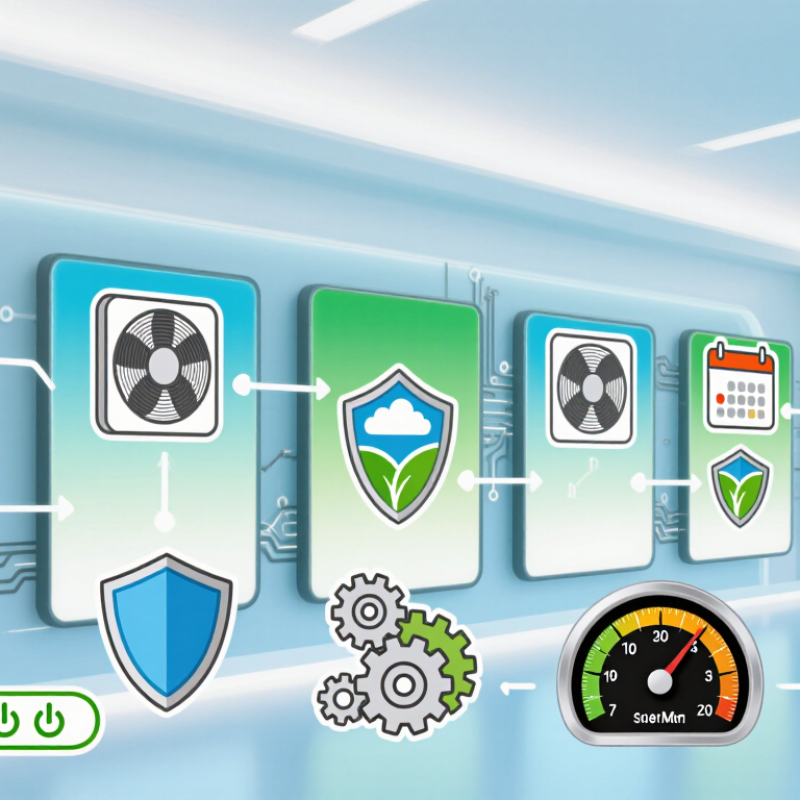
LED Display Power Baselines: DOE Reports LEDs Use at Least 75% Less Energy
The U.S. Department of Energy reports that LED lighting uses at least 75% less energy than incandescent lighting. This benchmark matters when global buyers compare display technologies. However, an LED display is more than its diodes. Receiving cards, power supplies, cooling fans, and control systems also consume electricity. A low-energy claim needs context.
Ask suppliers for measured power consumption per square meter. Request both average and maximum figures. A bright outdoor screen may draw 450 watts per square meter at full white. Content with darker colors can reduce real operating demand. Automatic brightness sensors help during cloudy mornings or quiet evening hours. Scheduling also prevents a display from running unnecessarily overnight.
I have seen buyers focus on pixel pitch and overlook ventilation. That was an expensive mistake. Poor airflow can increase fan use and shorten component life. Choose efficient power supplies, accessible monitoring, and realistic brightness settings. Check testing conditions carefully. Some figures exclude control equipment. Others describe short laboratory tests, not twelve-hour daily operation. A simple energy estimate should include screen size, operating hours, local electricity rates, and seasonal brightness changes. The result may be less impressive, but it is more useful.
LED Display Power Baselines and Practical Efficiency Targets
| Tip | Energy-Saving Dimension | Reference Baseline | Recommended LED Target | Potential Energy Reduction | Buyer Action |
|---|---|---|---|---|---|
| 1 | Choose LED technology instead of incandescent or halogen lighting for illuminated display elements. | Incandescent lighting can consume substantially more electricity for the same light output. | Use high-efficacy LED modules, typically designed for lower wattage at equivalent brightness. | At least 75% versus incandescent lighting | Request the rated power, luminous output, and operating temperature of the complete display system. |
| 2 | Specify an appropriate pixel pitch and viewing distance. | Excessively fine pixel pitch increases the number of pixels and LED components per square metre. | Match pixel pitch to viewing distance, content type, and required image detail. | Commonly 10–35% lower system power than an unnecessarily fine-pitch design | Compare total watts per square metre for technically equivalent solutions, not only pixel resolution. |
| 3 | Use automatic brightness control based on ambient light. | Fixed maximum brightness can operate the display above the level needed during cloudy conditions, indoor use, or nighttime. | Install a calibrated ambient-light sensor with scheduled brightness limits. | Often 20–50% lower average power in variable-light environments | Ask for the brightness-control range, sensor location, calibration method, and fail-safe setting. |
| 4 | Set a content brightness limit. | White or highly saturated content generally drives more LED channels than darker content. | Use content-management rules that limit unnecessary full-white scenes and excessive saturation. | Approximately 10–30% lower average power, depending on content | Evaluate power consumption using representative campaign content rather than a full-white test image alone. |
| 5 | Check maximum, typical, and standby power separately. | Maximum power is usually measured with the display showing a high-load test pattern; it is not the same as average operating power. | Obtain three clearly identified figures in watts per square metre: maximum, typical, and standby. | Improves load planning and can prevent 10–20% oversizing of power infrastructure | Use typical power for energy budgeting and maximum power for cables, breakers, and thermal design. |
| 6 | Use efficient power supplies with suitable load matching. | Power-supply losses increase when units are poorly sized, lightly loaded, or operated in unsuitable conditions. | Select power supplies with published efficiency data and adequate but not excessive capacity. | Typically 3–8% lower input power than a basic, poorly matched supply arrangement | Request efficiency curves or test data at the expected operating load, voltage, and frequency. |
| 7 | Improve ventilation and thermal management. | High internal temperature can reduce component efficiency, shorten service life, and trigger additional cooling demand. | Use unobstructed airflow, suitable cabinet spacing, and temperature monitoring. | Approximately 2–10% lower total energy use where active cooling is required | Confirm the operating-temperature range and whether fans, air conditioning, or other cooling equipment is needed. |
| 8 | Schedule automatic operating hours. | Displays may remain powered during closed hours or periods with no audience. | Use timers, network scheduling, or building-management integration for automatic shutdown and startup. | Potentially 10–30% lower annual energy use, depending on unused operating hours | Define operating calendars for weekdays, weekends, holidays, and local time zones. |
| 9 | Minimize standby consumption. | Network equipment, control cards, sensors, and power supplies can continue drawing energy when the display is not showing content. | Use low-standby components and a controlled power-down mode when permitted by the application. | Up to 1–5% of annual display energy in frequently idle installations | Measure standby watts at the complete system level, including controllers and communications equipment. |
| 10 | Verify energy data with independent measurement and periodic maintenance. | Dust, blocked ventilation, aging modules, poor connections, and calibration drift can increase operating losses. | Record voltage, current, power factor, temperature, and brightness during commissioning and routine inspections. | Commonly 3–10% avoidable energy use recovered through maintenance and calibration | Require an acceptance test using a calibrated power meter and retain monthly energy records. |
Reference note: The U.S. Department of Energy reports that residential LEDs use at least 75% less energy and last up to 25 times longer than incandescent lighting. This benchmark applies to incandescent-to-LED lighting comparisons; actual LED-display savings depend on display architecture, brightness, content, operating hours, climate, and control settings.
Calculation basis: Annual energy use can be estimated as: average power (kW) × operating hours × number of operating days. The percentage ranges above are planning estimates, not guaranteed product results. Buyers should validate them with complete-system measurements under local voltage, ambient-light, and content conditions.

© 2024 Sierramotion. All Rights Reserved